Integrated process monitoring of dosing pressures
Detect and avoid errors during dispensing with the flowplus16 and flowscreen
Integrated dispensing process monitoring in the application
The entire dosing process can be influenced by a wide variety of disturbance variables: For example, faulty dosing can impair the quality of the components and the consumption of the material. A material shortage that has not been detected in time and the dispensing system is running dry can also have a negative effect on the service life of the dispensing system.
Especially in microdispensing, the application of the material must be accurate and with the highest possible reproducibility. In this case, the metering pressure is the decisive physical quantity to obtain information from the process.
The graphic pressure evaluation unit flowscreen
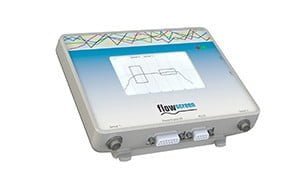
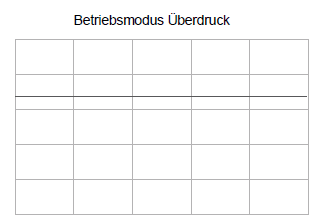
Using the flowscreen, the measured values detected by the sensor can be made available to the end user in edited form. From a technical point of view, the flowscreen is a robust and very compact evaluation device with its small dimensions (19 x 13.5 x 3.5 cm). With its specially developed software, the analog input signals of connected sensors are modeled according to time and pressure on the 4.3″ TFT display in the XY axis. This enables the user to monitor the pressure profile of up to two connected sensors during a dosing process in almost real time. In order to guarantee constant process parameters and reproducible series processes, evaluation criteria can be defined by a touch-screen application-specific in the teach-in method. As shown in Fig. 3, the process monitoring is based on two different operating modes.
While in “Range” mode the entire spectrum of a pressure curve can be precisely specified, the “Overpressure” operating mode is used for individually configurable detection of load peaks. Regardless of the application, the sampling rate of the flowscreen is adjusted dynamically in the range of 200Hz – 2Hz. Here, the measuring time of the dosage to be monitored can be from 0.1 seconds up to 33 minutes. If a process parameter in repetitive manufacturing violates one of the defined evaluation criteria, a red error LED lights up and a screen message is displayed. In addition, the flowscreen can also be connected to a higher-level controller. Deviations in the manufacturing process are thus visualized, recognized promptly and a good/bad evaluation is carried out. In this way, components with insufficient quality can be taken out of the production line and/or process parameters can be readjusted. A cumulative error reaction is possible as well as an immediate deactivation of the dosing system. For sustainable quality assurance, the collected data can be exported externally via the serial interface RS232 for complete documentation of the respective application.
Pressure detected – Process banned!
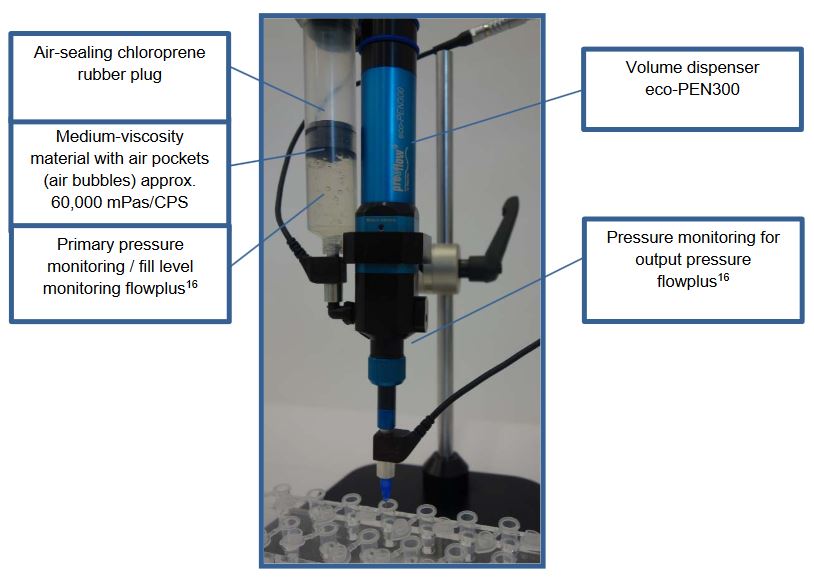
Be it optical bonding, conformal coating or encapsulating: Fig. 4 shows a simple and quickly adaptable process design that guarantees maximum process reliability for numerous manufacturing processes, especially in microdispensing technology.
The following process uses the eco-PEN300 as dispenser. Inlet and outlet pressure are monitored by a flowplus16 pressure sensor. The former additionally assumes the function of level monitoring of the medium to be dosed. This is a medium-viscosity, transparent gel with a viscosity of approx. 60,000 mPas/CPS. The degassing of the medium was deliberately avoided to demonstrate the detectability of the air bubbles trapped in the material. The use of an air-sealing stopper (e. g. made of chloroprene rubber) is very important for a successful level monitoring, as it prevents the creation of a pressure equilibrium in the system of the cartridge/ stopper medium and thus enables the detection of the pressure drop in case of media undersupply (empty cartridge).
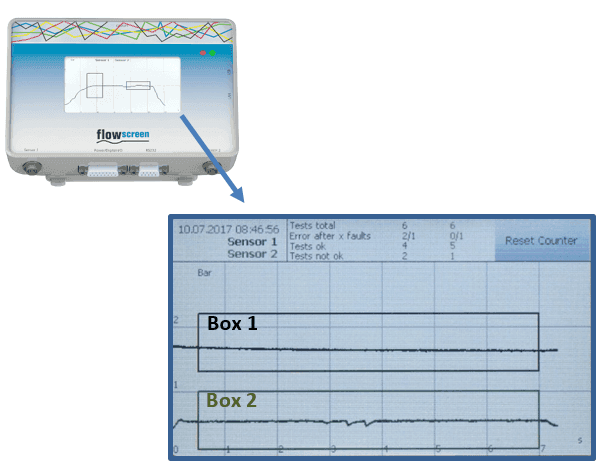
With the flow screen, it is possible to graphically display the input and output pressure and define individual evaluation criteria for process monitoring. In the current application, the measurement is controlled by a start and stop signal and an evaluation box per sensor and graph is selected as the evaluation criterion. The box boundaries define the frame within which the printing graph moves during a good dosage. If the graph leaves these limits during production, the system detects the deviation and triggers an error message – dosing is interrupted. However, the dosing can only be stopped after a cumulative number of errors has been reached in order to avoid an immediate shutdown of the system.
Box 1: defines the limits within which the printing graph must move. The graphically displayed pressure curve of the upstream pressure (sensor 1) is clearly visible.
Box 2: defines the limits within which the pressure graph of the visualized metering pressure (sensor 2) must move.
Figure 6, however, shows the visualization of the decreasing cartridge pressure. This is clearly visible from the decreasing upstream pressure (sensor 1):

Box 1: Due to the decreasing cartridge pressure, the evaluation unit detects a violation of one of the defined evaluation criteria and triggers an error message. The color of box 1 (sensor 1) changes to red.
Box 2: If you look at the visualized pressure curve of the output pressure (sensor 2), you can see that there has not yet been a material undersupply of the dispenser. Due to the high sampling rate of up to 3 kHz, however, the device does not miss the fact that air bubbles are present in the material. Red marked clearly shows that there are fluctuations in the dosing pressure curve. If the thread breaks off due to excessive air bubbles, the acute short-term pressure drop would also trigger an error message.
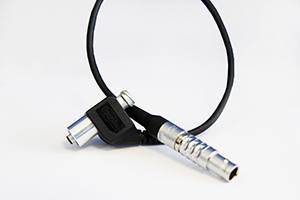
The complete process monitoring system consists of the graphic pressure evaluation system flowscreen and the piezoresistive relative pressure sensor flowplus16, which enables the customer to monitor the dosing process in practically every area of application and ensures the necessary process stability for the respective series production.
flowplus16 and flowsrceen… We take the pressure off your controller

